


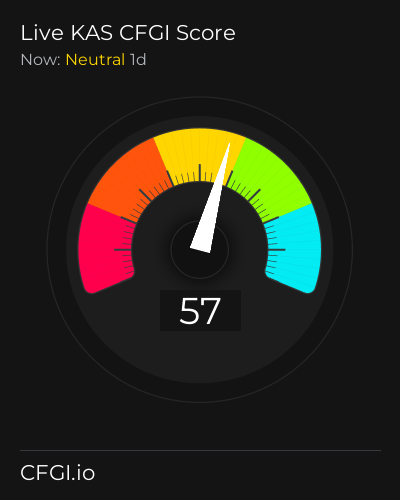
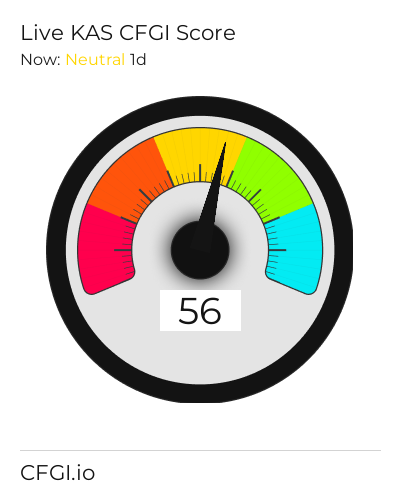
Sentiment
The Kaspa Fear and Greed Index is a multifactorial indicator for cryptocurrency sentiment analysis, which considers the most critical parameters that determine the psychology of the Kaspa market to give a result that defines the level of fear or greed in the market.
The Kaspa Fear and Greed Index values range from 0% (extreme fear) to 100% (extreme greed).
The values are:
0 - 19: EXTREME FEAR
20 - 39: FEAR
40 - 59: NEUTRAL
60 - 79: GREED
80 - 100: EXTREME GREED
The Price Score indicator is a relevant indicator to analyze and assign the Kaspa price evolution a certain numerical value.
This module studies the price trend to determine if the Kaspa market has a bearish or bullish trend.
The main trend defines one part of the general sentiment of the market, and is a factor of weight when analyzing a chart. A pronounced and long-lasting positive trend generates a greater feeling of greed. In the same way, when the trend is negative, a greater feeling of fear is generated, regardless of other factors.
Price Volatility is also another important indicator and the biggest trigger for market sentiment. To measure it, we use values between 0 and 1 that determine the degree of current Kaspa price fluctuation for the desired time frame.
Higher volatility implies a riskier market, which further polarizes bullish and bearish sentiments. An increase in volatility implies greater greed in a bull market, but also greater fear in a bear market.
Like volatility, the Kaspa Volume is a determining factor.
An increase in the volume implies a greater negotiation in the market, which is caused by an increase in the movements caused by an interest, which is synonymous with great sentiment. A strong volume determines a strong level of greed in Kaspa bull markets, but also a strong level of panic in bear markets.
Like volatility, it is also calculated with a range between 0 and 1.
The Impulse indicator measures the current Kaspa price strength compared to previous values to determine in a range from -1 to 1 how it is affecting the Kaspa market sentiment.
Impulse has a huge impact on sentiment, as on a psychological level we tend to place more importance on the latest price move.
The strength of this shows price inclination that can be more or less pronounced and determines the polarity. A strong bullish impulse in a market implies a greater feeling of greed, in the same way that a strong bearish impulse generates a greater feeling of fear or panic.
It is proven that technical analyzes themselves influence market sentiment, especially those that are more popular.
The technical analysis indicator analyzes for Kaspa the 26 most popular stock market indicators and subdivides them into 2 main categories that differentiate them in their type of trend indicator or oscillator. Subsequently, each one of them is averaged and assigned a certain weight based on the popularity of each one. These results fairly accurately reflect the impact generated by these charts on market analysts.
This other indicator takes into account the dominance of Kaspa with respect to the general market. When it gets greedy, altcoin investments greatly increase and the total market capitalization increases, which also decreases Kaspa's dominance. The same thing happens when the market panics but in reverse. For this reason, both the token capitalization and the total market capitalization are calculated.
But there is also a correlation between the dominance of Kaspa and the dominance of the main altcoins, so the indicator calculates different values for each cryptocurrency.
Trends is another factor that determines the sentiment of a particular market. We analyze the search volume on Kaspa has on major search engines on Google.
The lookup indicator looks at the current value and compares it to previous values to determine what particular interest there is in Kaspa. For this, specific search terms are used that determine the purchasing or ceding interest of Kaspa, thus excluding general terms that only define popularity without demonstrating negativity or possibility.
One of the analyzes that can determine the cryptocurrency market is the movement of whales.
CFGI analyzes the movements of superlative amounts made by large investors in two ways, first it analyzes large movements from wallets to exchanges of Kaspa and compares them with the large movements of stable coins that are also made from wallets to exchanges to estimate the proportion of purchase and sale to be made.
A high ratio of Kaspa moves to stablecoins indicates strong selling intent which means greed market, while a higher ratio of stablecoins moves indicates stronger buying intent and fear market.
Another great predictor of sentiment through a quantitative source are the order books. Crypto Fear and Greed Index analyzes the order book for Kaspa on a popular exchange to determine the buying and selling pressure that contiguous orders exert on the price. In such a way that you can know the buying and selling pressure that the orders which are going to be executed will exert.
Stronger buying pressure than selling pressure close to price is a clear indication of bearish sentiment, as there are more buy orders within equal distance to the price. While stronger selling pressure above price indicates a bullish sentiment, because there are more sells to execute than buys at the same distance.
Sign up now to unlock order book historical
Sign up