Historical Values
-
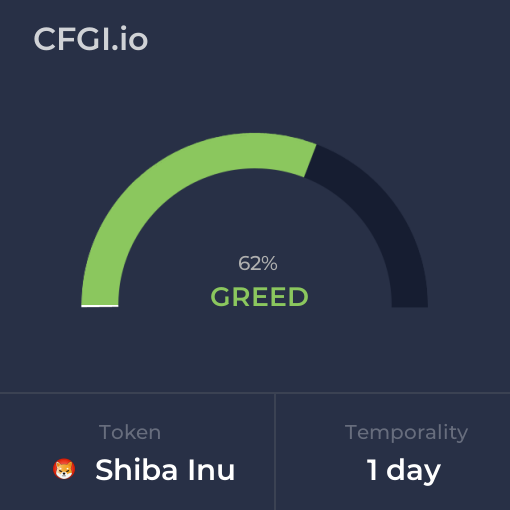
Now
Neutral 49 -
Yesterday
Neutral 49 -
7 Days Ago
Neutral 49 -
1 Month Ago
Neutral 49
Shiba Inu Breakdown
Price Score Neutral
The Price Score indicator is a relevant indicator to analyze and assign the Shiba Inu price evolution a certain numerical value.
This module studies the price trend to determine if the Shiba Inu market has a bearish or bullish trend.
The main trend defines one part of the general sentiment of the market, and is a factor of weight when analyzing a chart. A pronounced and long-lasting positive trend generates a greater feeling of greed. In the same way, when the trend is negative, a greater feeling of fear is generated, regardless of other factors.
Volatility Greed
Price Volatility is also another important indicator and the biggest trigger for market sentiment. To measure it, we use values between 0 and 1 that determine the degree of current Shiba Inu price fluctuation for the desired time frame.
Higher volatility implies a riskier market, which further polarizes bullish and bearish sentiments. An increase in volatility implies greater greed in a bull market, but also greater fear in a bear market.
Volume Greed
Like volatility, the Shiba Inu Volume is a determining factor.
An increase in the volume implies a greater negotiation in the market, which is caused by an increase in the movements caused by an interest, which is synonymous with great sentiment. A strong volume determines a strong level of greed in Shiba Inu bull markets, but also a strong level of panic in bear markets.
Like volatility, it is also calculated with a range between 0 and 1.
Impulse Neutral
The Impulse indicator measures the current Shiba Inu price strength compared to previous values to determine in a range from -1 to 1 how it is affecting the Shiba Inu market sentiment.
Impulse has a huge impact on sentiment, as on a psychological level we tend to place more importance on the latest price move.
The strength of this shows price inclination that can be more or less pronounced and determines the polarity. A strong bullish impulse in a market implies a greater feeling of greed, in the same way that a strong bearish impulse generates a greater feeling of fear or panic.
Technical Fear
It is proven that technical analyzes themselves influence market sentiment, especially those that are more popular.
The technical analysis indicator analyzes for Shiba Inu the 26 most popular stock market indicators and subdivides them into 2 main categories that differentiate them in their type of trend indicator or oscillator. Subsequently, each one of them is averaged and assigned a certain weight based on the popularity of each one. These results fairly accurately reflect the impact generated by these charts on market analysts.
Social Extreme Greed
Dominance Neutral
This other indicator takes into account the dominance of Shiba Inu with respect to the general market. When it gets greedy, altcoin investments greatly increase and the total market capitalization increases, which also decreases Shiba Inu's dominance. The same thing happens when the market panics but in reverse. For this reason, both the token capitalization and the total market capitalization are calculated.
But there is also a correlation between the dominance of Shiba Inu and the dominance of the main altcoins, so the indicator calculates different values for each cryptocurrency.
Search Extreme Greed
Trends is another factor that determines the sentiment of a particular market. We analyze the search volume on Shiba Inu has on major search engines on Google.
The lookup indicator looks at the current value and compares it to previous values to determine what particular interest there is in Shiba Inu. For this, specific search terms are used that determine the purchasing or ceding interest of Shiba Inu, thus excluding general terms that only define popularity without demonstrating negativity or possibility.
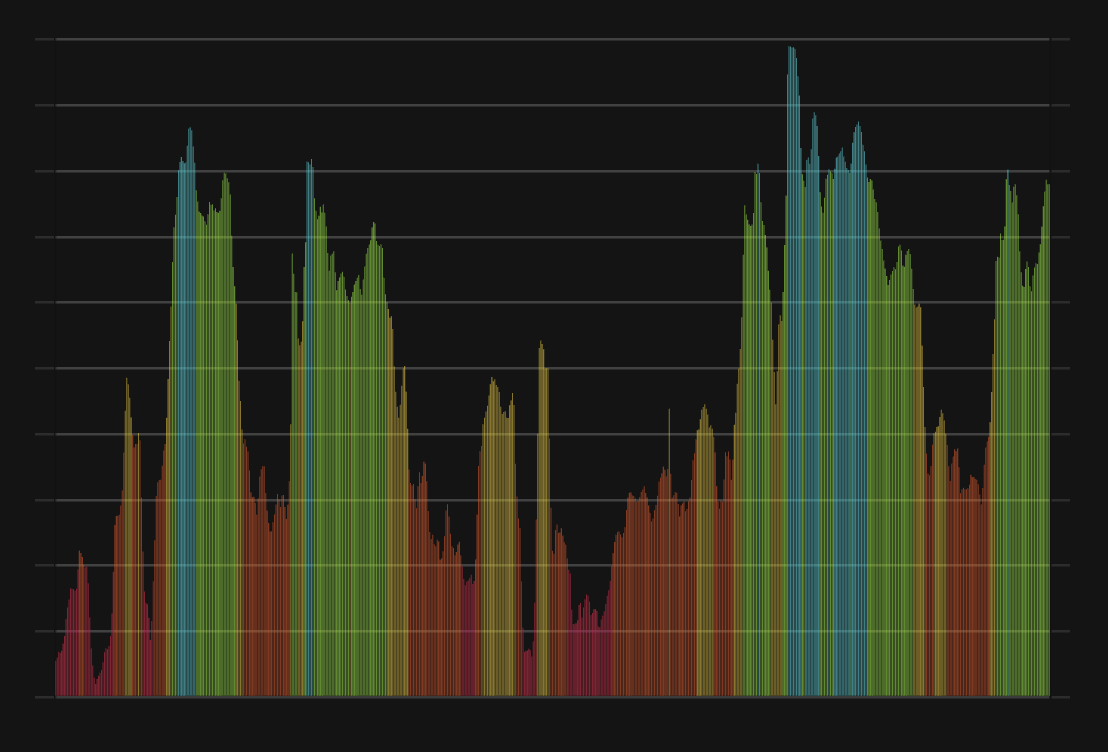
Whales Fear
One of the analyzes that can determine the cryptocurrency market is the movement of whales.
CFGI analyzes the movements of superlative amounts made by large investors in two ways, first it analyzes large movements from wallets to exchanges of Shiba Inu and compares them with the large movements of stable coins that are also made from wallets to exchanges to estimate the proportion of purchase and sale to be made.
A high ratio of Shiba Inu moves to stablecoins indicates strong selling intent which means greed market, while a higher ratio of stablecoins moves indicates stronger buying intent and fear market.
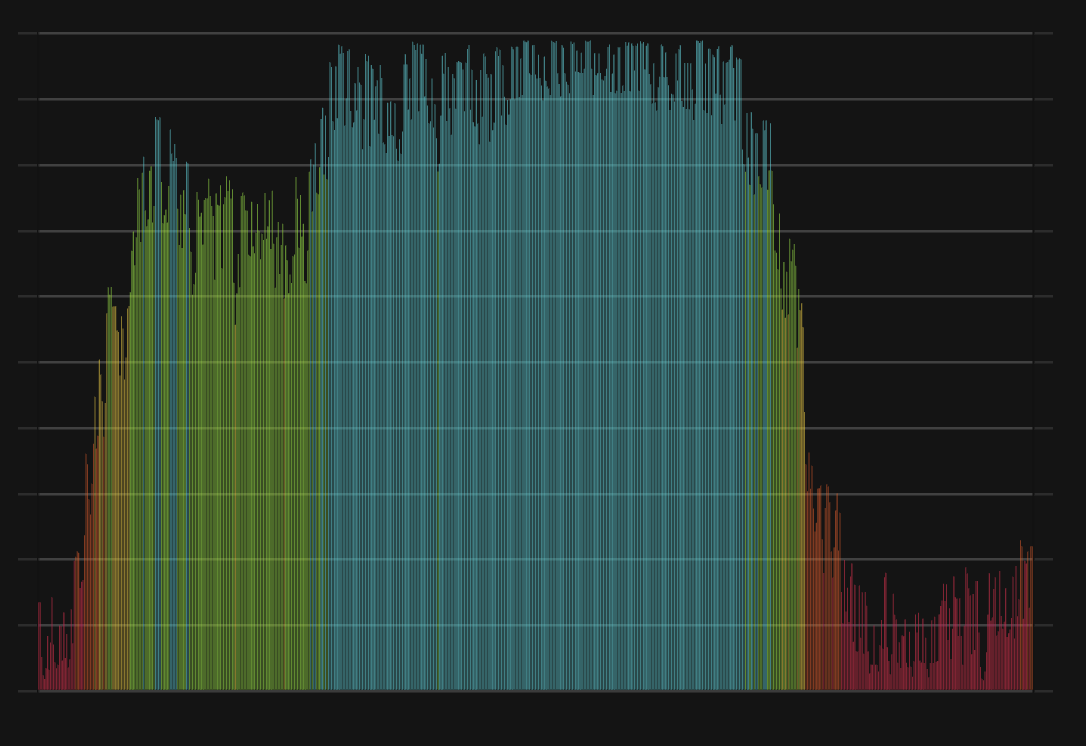
Order Book Fear
Another great predictor of sentiment through a quantitative source are the order books. Crypto Fear and Greed Index analyzes the order book for Shiba Inu on a popular exchange to determine the buying and selling pressure that contiguous orders exert on the price. In such a way that you can know the buying and selling pressure that the orders which are going to be executed will exert.
Stronger buying pressure than selling pressure close to price is a clear indication of bearish sentiment, as there are more buy orders within equal distance to the price. While stronger selling pressure above price indicates a bullish sentiment, because there are more sells to execute than buys at the same distance.
Shiba Inu News
Shiba Inu News
Shibarium Google Trends Hits Zero: Here's What It Means for SHIB Investors

Sentiment: Negative
Read moreShiba Inu Price Prediction: Will SHIB Break Below $0.0000057 or Stage a Recovery?

Sentiment: Negative
Read moreShiba Inu Tokens Burned Amid High World Uncertainty, SHIB Price Still Down

Sentiment: Negative
Read moreShiba Inu Price Falls Over 20% Monthly — Can SHIB Recover Amid Bearish Market Conditions?

Sentiment: Negative
Read moreSHIB Price Prediction: Will Shiba Inu Break Out of Its Tight Trading Range?
Sentiment: Neutral
Read moreSHIB Price Prediction: Technical Consolidation Signals Potential $0.000008 Target

Sentiment: Positive
Read moreShiba Inu (SHIB) Volatility Hits Ground as Price Enters Consolidation Period
Sentiment: Neutral
Read moreShiba Inu Tokens Left Unburned, SHIB Price Sees Daily Drops After Weekly Gains

Sentiment: Negative
Read moreKraken Moves 46 Billion Shiba Inu Tokens Worth $301K as SHIB Price Climbs

Sentiment: Positive
Read moreKraken Transfers 46 Billion Shiba Inu Tokens Worth $301,900 as SHIB Price Rises 1.3%

Sentiment: Positive
Read moreShiba Inu (SHIB) Exchange Netflow Hits Zero: Equilibrium Reached as Inflows Match Outflows
Sentiment: Positive
Read moreKraken Rebalances 46 Billion SHIB From Cold to Hot Storage for Exchange Operations
Sentiment: Neutral
Read moreSHIB Price Trends Toward $0.00000666, Level Traders Call 'Mark of the Beast'
Sentiment: Negative
Read moreSHIB Price Prediction: Technical Indicators Point to Mixed Signals as February 2026 Consolidation Continues

Sentiment: Neutral
Read moreMorning Crypto Report: Ripple CEO Says 'Not True' to Theranos Founder Elizabeth Holmes, Shiba Inu (SHIB) Sees 71% Increase in Trading Activity After New 'Easter Egg' Appears, Tom Lee Reveals 'Crypto Winter' Prediction for 2026

Sentiment: Positive
Read moreSHIB Price Prediction: Neutral Consolidation Phase Amid Technical Uncertainty

Sentiment: Neutral
Read moreSHIB Price Prediction: Technical Analysis Points to $0.0000085 Target as RSI Shows Neutral Momentum
Sentiment: Positive
Read moreShiba Inu's 140 Billion SHIB Exchange Outflow: Implications for Market Liquidity
Sentiment: Positive
Read moreShiba Inu (SHIB) Eyes $0.0000065 Target Ahead of Friday the 13th CPI Report
Sentiment: Positive
Read moreSHIB Price Prediction: Technical Indicators Point to $0.0000085 Target as RSI Shows Oversold Conditions

Sentiment: Positive
Read moreShiba Inu (SHIB) Plunges by 20% in 2 Weeks: Another 80% Crash Comes Next?

Sentiment: Negative
Read moreShiba Inu Slips to Key Range as 700 Billion SHIB Flood Exchanges — Crash or Comeback?
Sentiment: Negative
Read moreShiba Inu Price Prediction: SHIB Rebounds 5% But Channel Breakdown Warns of $0.00000138 Drop

Sentiment: Negative
Read moreShiba Inu Price Prediction: SHIB Tests $0.00000581 Support as Analyst Eyes $0.00002 Rally

Sentiment: Positive
Read moreDOGE, SHIB, PEPE Suffer Brutal Crash—But Only One Has A Chance At A Reversal

Sentiment: Negative
Read moreSHIB Price Prediction: Targets $0.0000085 by End of February 2026 Amid Technical Consolidation

Sentiment: Positive
Read moreSHIB Army Burns 3,564,772 SHIB, While Half Quadrillion Coins Remain in Circulation
Sentiment: Neutral
Read moreShiba Inu (SHIB) at Lowest Level Since 2023; Crypto Market Still Loses to Gold
Sentiment: Negative
Read more2026 Market Outlook: Analyzing SHIB and BNB Price Levels Amid ZKP's Auction Momentum

Sentiment: Neutral
Read moreShiba Inu Price Prediction: SHIB Could Drop to $0.0000055 as Bearish Pattern Holds

Sentiment: Negative
Read moreShiba Inu's Top Dev Emphasizes Long-Term Focus as SHIB Flirts with Historical Support

Sentiment: Neutral
Read moreShiba Inu (SHIB) Key 82,000,000,000,000 Threshold Gone: Retail Investors Moving to Self-Custody

Sentiment: Negative
Read moreSHIB Price Prediction: Targets $0.0000085 by Late February as Technical Recovery Emerges

Sentiment: Positive
Read moreU.Today Crypto Digest: Key Shiba Inu (SHIB) Metric Says Demand Is Back, Big XRP Reveal Expected This Week, Bitcoin (BTC) Hits 7,132% Bullish Liquidation Imbalance
Sentiment: Positive
Read moreShiba Inu (SHIB) Painting Worst Pattern Imaginable: Here's Where It Might Recover
Sentiment: Negative
Read moreMorning Crypto Report: XRP Skyrockets $63.1 Million on Its Own ETF Bull Market, 23,799,579,141 SHIB: Coinbase Whale Grabs Billions of Shiba Inu and Disappears, Dogecoin Creator's Crypto Market Prediction Amid Super Bowl Comes True
Sentiment: Positive
Read moreSHIB Price Prediction: Analysts Target Recovery to $0.0000085 Despite Technical Headwinds
Sentiment: Positive
Read more20,841,045,129 SHIB Go Offline From Major Crypto Exchange Right as Shiba Inu Coin Price Jumps 22% in Recovery Bull Market
Sentiment: Positive
Read moreShiba Inu (SHIB) Bounces 23% in Blink of an Eye: Is Recovery Only Question of Time?
Sentiment: Positive
Read moreSHIB Alert: Shiba Inu Team Warns Wallet Users of Potential Security Risk
Sentiment: Negative
Read moreDogecoin Sees 36% Activity Spike While DOGE And SHIB Test Critical Support

Sentiment: Negative
Read moreXRP and Shiba Inu (SHIB) in Focus: Is Latest $1,000,000,000 USDT Mint a Bear Market Turning Point?
Sentiment: Positive
Read moreShiba Inu Price Prediction: 9,000% Liquidation Imbalance Hits After Death Cross – Is SHIB About to Collapse?
Sentiment: Negative
Read moreU.Today Crypto Digest: Shiba Inu (SHIB) Spot Flows Soar 1,546%, XRP Sees 5,419% Futures Activity Surge, Binance's CZ Shuts Down Bitcoin Manipulation Claims

Sentiment: Positive
Read moreMorning Crypto Report: XRP Officially Decouples From Bitcoin Amid $850 Million Bloodbath, Ripple's Main Japanese Ally to Launch Own Blockchain, Shiba Inu (SHIB) Eyes 26% Discount Thanks to Bear Market
Sentiment: Negative
Read more332,497,400,000 SHIB Flash Bearish Signal: How Long Until Shiba Inu Recovers?
Sentiment: Negative
Read moreSHIB Price Prediction: Technical Recovery Signals Target $0.0000085 Despite Current Oversold Conditions

Sentiment: Positive
Read moreCrypto Market Prediction: Will XRP Break Bullish Trap? Shiba Inu's (SHIB) 3 Bullish Targets, Ethereum's (ETH) 300-Day Record Broken
Sentiment: Positive
Read moreMeme Coin Bloodbath: Can DOGE and SHIB Crash to $0 in 2026? 4 AIs Make Predictions

Sentiment: Negative
Read moreShiba Inu (SHIB) Hits 9,000% Liquidation Imbalance Right After Death Cross: Is $0 for SHIB Price Real?
Sentiment: Negative
Read moreShiba Inu Spot Flows Surge 1,546% in 24 Hours, But SHIB Price Stays in Red
Sentiment: Negative
Read moreSHIB Price Prediction: Mixed Signals Point to $0.0000085 Target by February End

Sentiment: Positive
Read moreTop Shiba Inu Executive Predicts SHIB Comeback as Community Pushes for Gains

Sentiment: Positive
Read moreShiba Inu's Worst Case? 81% Drop on Table If SHIB Sellers Win This Level
Sentiment: Negative
Read moreMorning Crypto Report: Ripple's Largest Stablecoin Mint Stuns XRP With $59 Million; 162,874,151,430 Shiba Inu (SHIB) Reactivated by Major Exchange After Three Weeks; Dogecoin (DOGE) Finally Breaks $0 ETF Streak
Sentiment: Positive
Read moreSHIB Price Prediction: Can the Life-Long Support Level Trigger a 380% Breakout?
Sentiment: Positive
Read moreSHIB Price Prediction: Targets $0.0000085 by Month-End Amid Mixed Technical Signals

Sentiment: Positive
Read moreShiba Inu Price Prediction: SHIB Just Crashed to a 3-Year Low – Is SHIB Going to $0?
Sentiment: Negative
Read moreU.Today Crypto Digest: Shiba Inu (SHIB) Eyes Potential 700% Rally, XRP Ledger Breaks Historical Record, Peter Brandt Issues Bearish Bitcoin Price Prediction

Sentiment: Positive
Read moreSHIB Price Prediction: Analysts Target $0.0000085 by Month-End Amid Technical Recovery

Sentiment: Positive
Read moreHistorical Values
-
Now
Neutral 49 -
Yesterday
Neutral 49 -
7 Days Ago
Neutral 45 -
1 Month Ago
Neutral 43
Shiba Inu Breakdown
Price Score Neutral
The Price Score indicator is a relevant indicator to analyze and assign the Shiba Inu price evolution a certain numerical value.
This module studies the price trend to determine if the Shiba Inu market has a bearish or bullish trend.
The main trend defines one part of the general sentiment of the market, and is a factor of weight when analyzing a chart. A pronounced and long-lasting positive trend generates a greater feeling of greed. In the same way, when the trend is negative, a greater feeling of fear is generated, regardless of other factors.
Volatility Greed
Price Volatility is also another important indicator and the biggest trigger for market sentiment. To measure it, we use values between 0 and 1 that determine the degree of current Shiba Inu price fluctuation for the desired time frame.
Higher volatility implies a riskier market, which further polarizes bullish and bearish sentiments. An increase in volatility implies greater greed in a bull market, but also greater fear in a bear market.
Volume Greed
Like volatility, the Shiba Inu Volume is a determining factor.
An increase in the volume implies a greater negotiation in the market, which is caused by an increase in the movements caused by an interest, which is synonymous with great sentiment. A strong volume determines a strong level of greed in Shiba Inu bull markets, but also a strong level of panic in bear markets.
Like volatility, it is also calculated with a range between 0 and 1.
Impulse Neutral
The Impulse indicator measures the current Shiba Inu price strength compared to previous values to determine in a range from -1 to 1 how it is affecting the Shiba Inu market sentiment.
Impulse has a huge impact on sentiment, as on a psychological level we tend to place more importance on the latest price move.
The strength of this shows price inclination that can be more or less pronounced and determines the polarity. A strong bullish impulse in a market implies a greater feeling of greed, in the same way that a strong bearish impulse generates a greater feeling of fear or panic.
Technical Fear
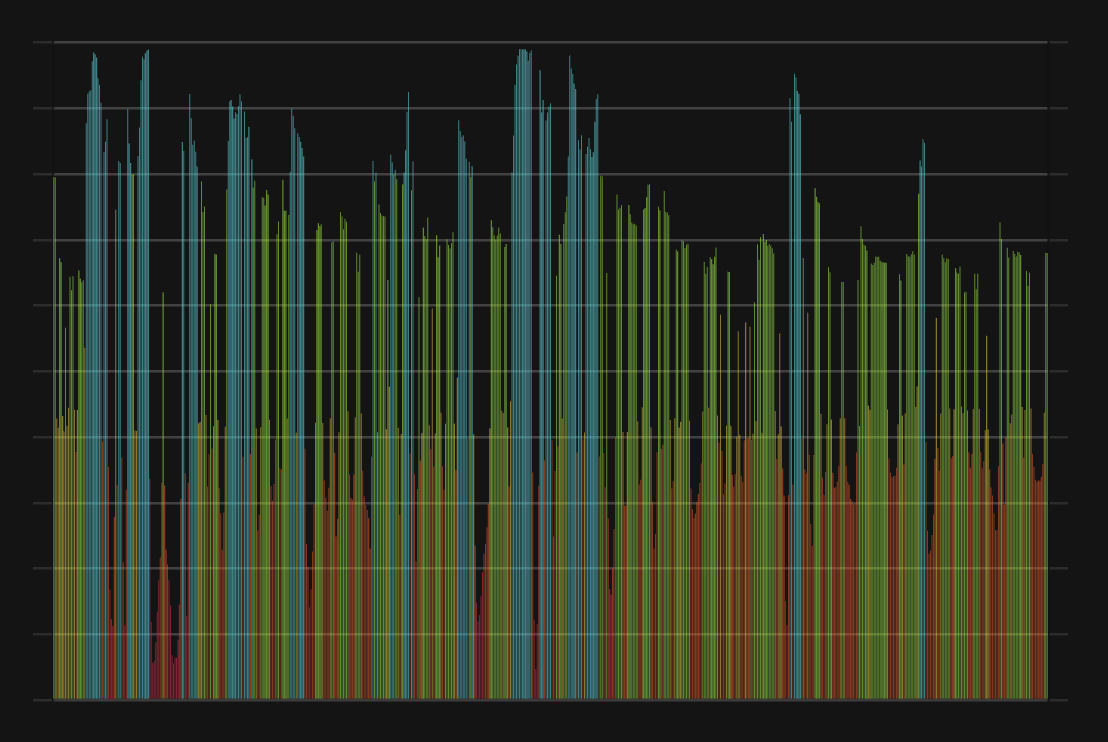
It is proven that technical analyzes themselves influence market sentiment, especially those that are more popular.
The technical analysis indicator analyzes for Shiba Inu the 26 most popular stock market indicators and subdivides them into 2 main categories that differentiate them in their type of trend indicator or oscillator. Subsequently, each one of them is averaged and assigned a certain weight based on the popularity of each one. These results fairly accurately reflect the impact generated by these charts on market analysts.
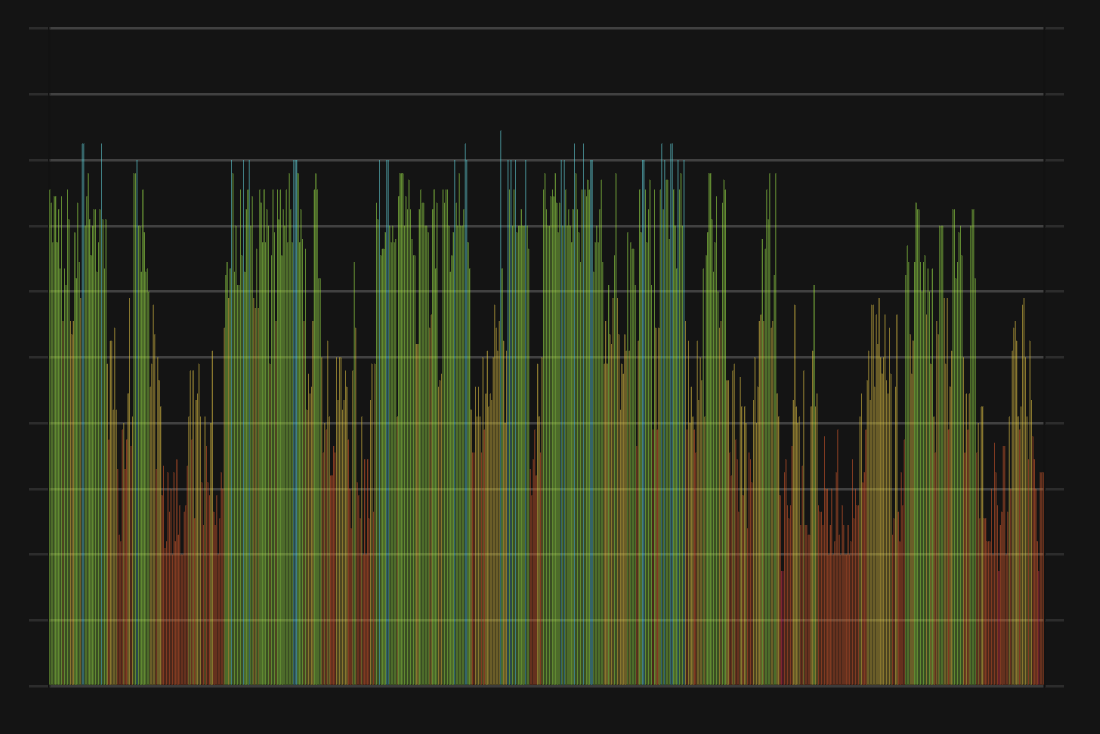
Social Extreme Greed
Dominance Neutral
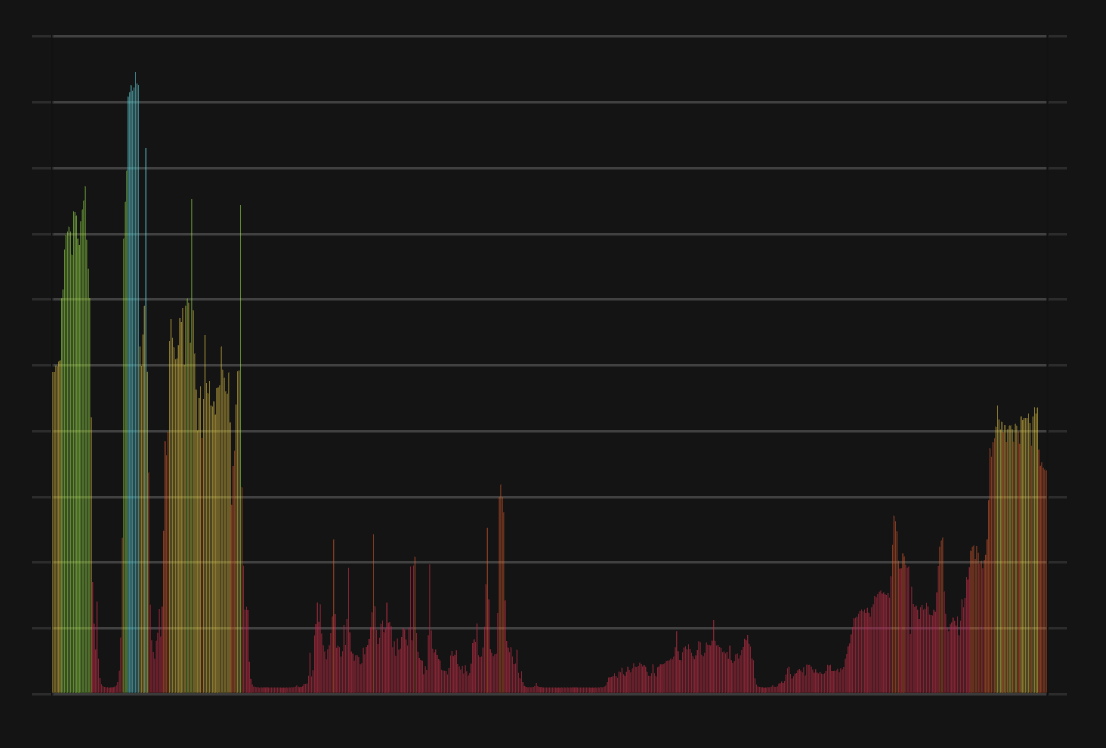
This other indicator takes into account the dominance of Shiba Inu with respect to the general market. When it gets greedy, altcoin investments greatly increase and the total market capitalization increases, which also decreases Shiba Inu's dominance. The same thing happens when the market panics but in reverse. For this reason, both the token capitalization and the total market capitalization are calculated.
But there is also a correlation between the dominance of Shiba Inu and the dominance of the main altcoins, so the indicator calculates different values for each cryptocurrency.
Search Extreme Greed
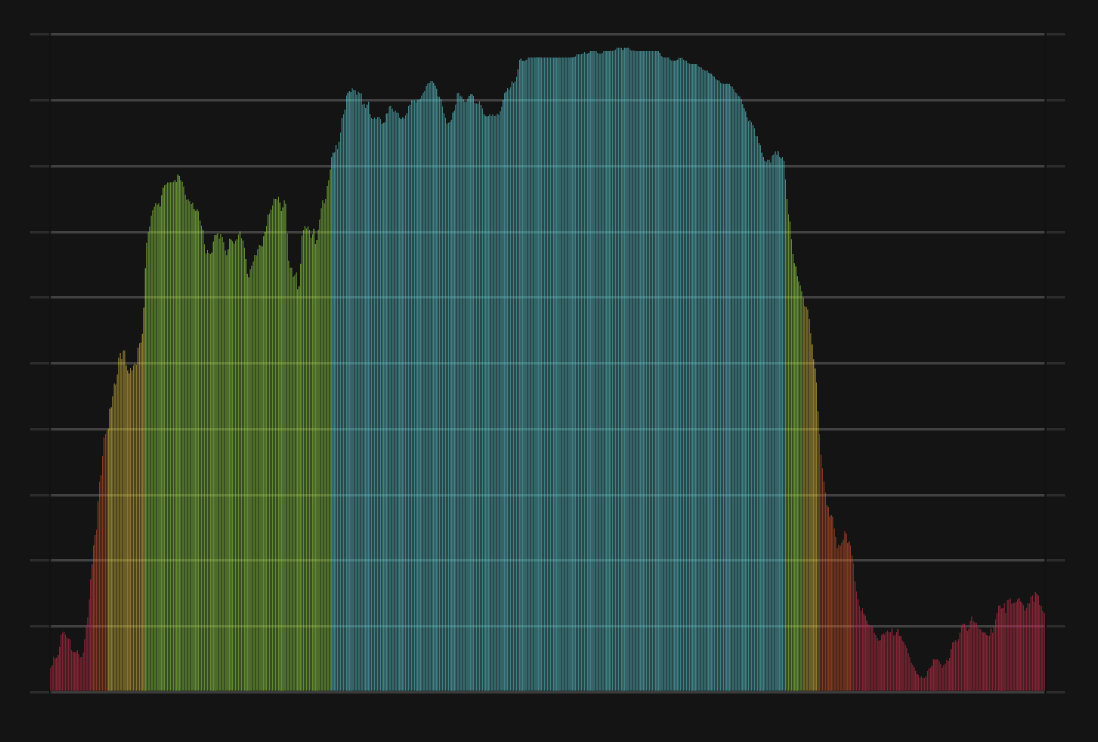
Trends is another factor that determines the sentiment of a particular market. We analyze the search volume on Shiba Inu has on major search engines on Google.
The lookup indicator looks at the current value and compares it to previous values to determine what particular interest there is in Shiba Inu. For this, specific search terms are used that determine the purchasing or ceding interest of Shiba Inu, thus excluding general terms that only define popularity without demonstrating negativity or possibility.
Whales Fear
One of the analyzes that can determine the cryptocurrency market is the movement of whales.
CFGI analyzes the movements of superlative amounts made by large investors in two ways, first it analyzes large movements from wallets to exchanges of Shiba Inu and compares them with the large movements of stable coins that are also made from wallets to exchanges to estimate the proportion of purchase and sale to be made.
A high ratio of Shiba Inu moves to stablecoins indicates strong selling intent which means greed market, while a higher ratio of stablecoins moves indicates stronger buying intent and fear market.
Order Book Fear
Another great predictor of sentiment through a quantitative source are the order books. Crypto Fear and Greed Index analyzes the order book for Shiba Inu on a popular exchange to determine the buying and selling pressure that contiguous orders exert on the price. In such a way that you can know the buying and selling pressure that the orders which are going to be executed will exert.
Stronger buying pressure than selling pressure close to price is a clear indication of bearish sentiment, as there are more buy orders within equal distance to the price. While stronger selling pressure above price indicates a bullish sentiment, because there are more sells to execute than buys at the same distance.
SHIB Price
1 SHIB = $0.00000626
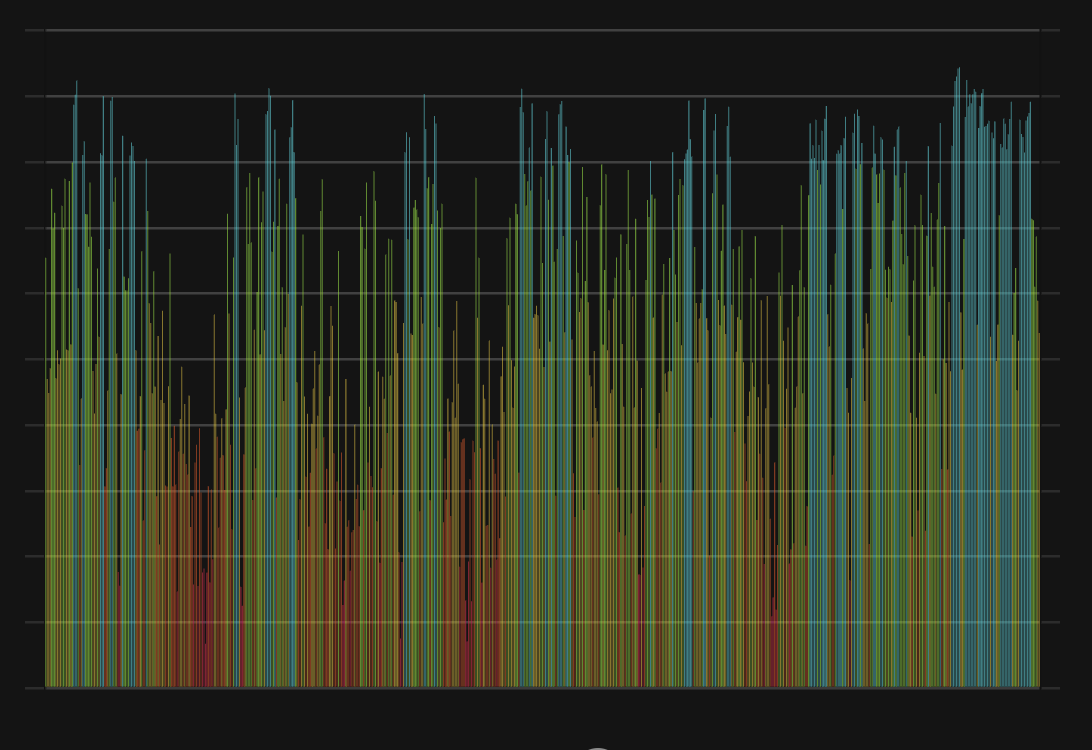
Shiba Inu CFGI Score & SHIB Price History

SHIB Price & Shiba Inu Sentiment Breakdown Charts
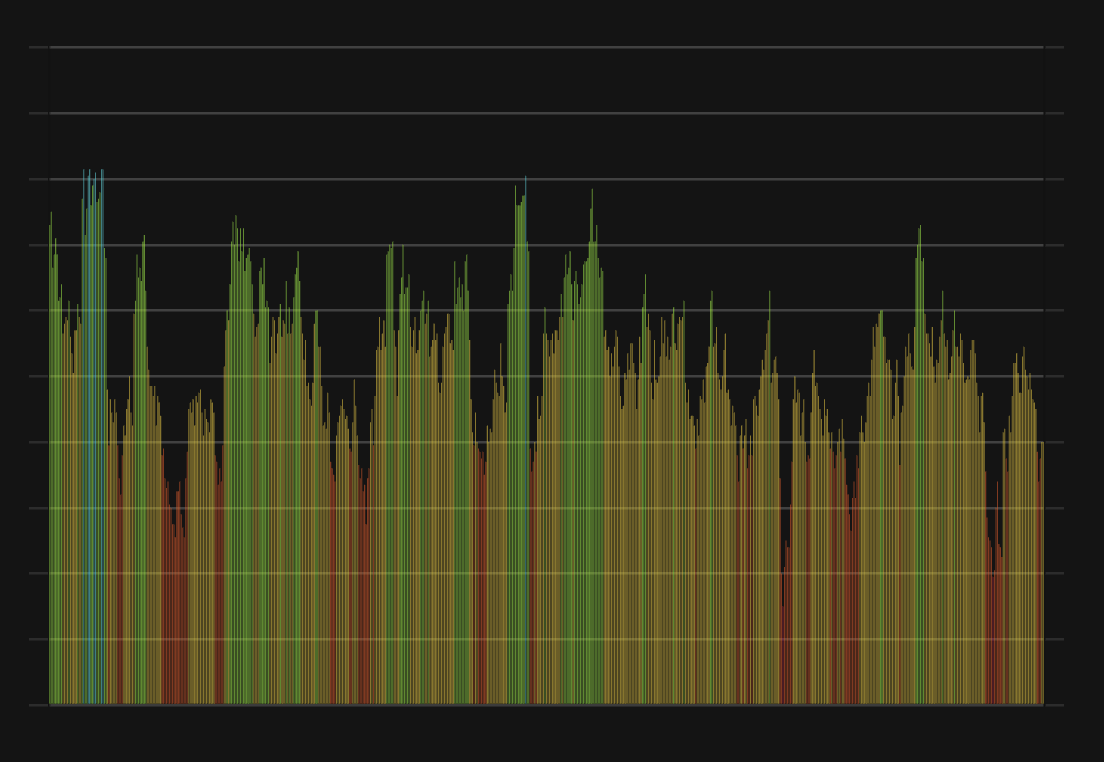
Price Score Sentiment
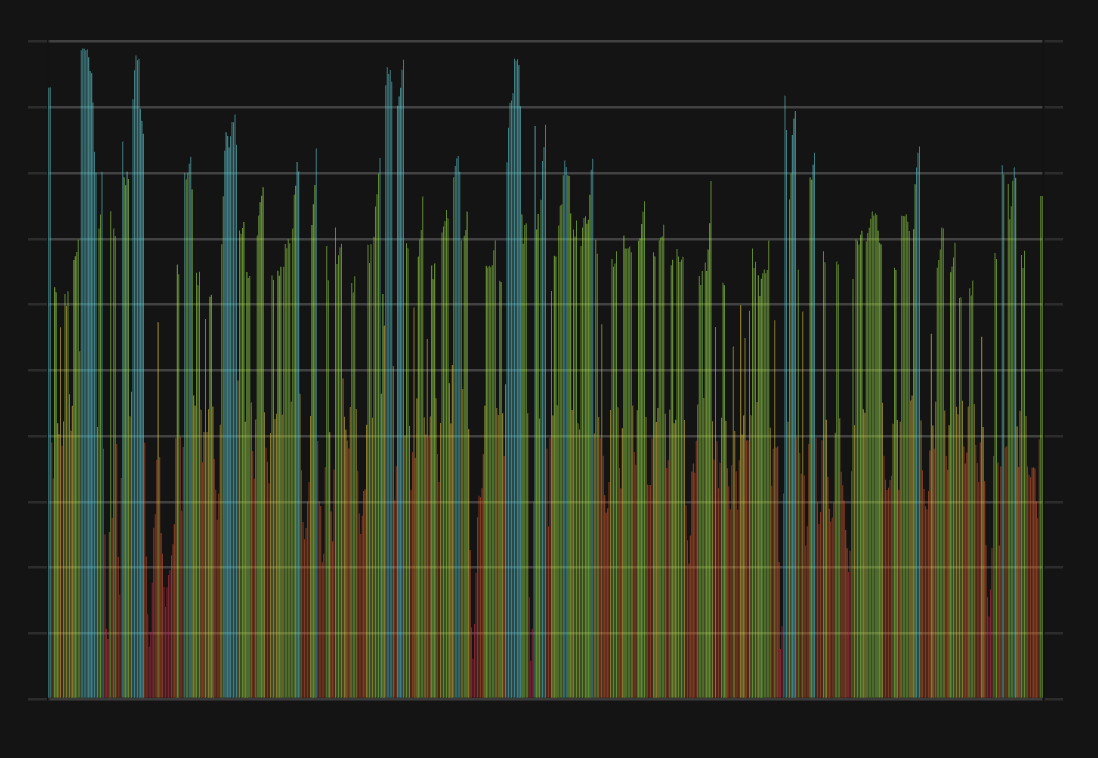
Volatility Sentiment
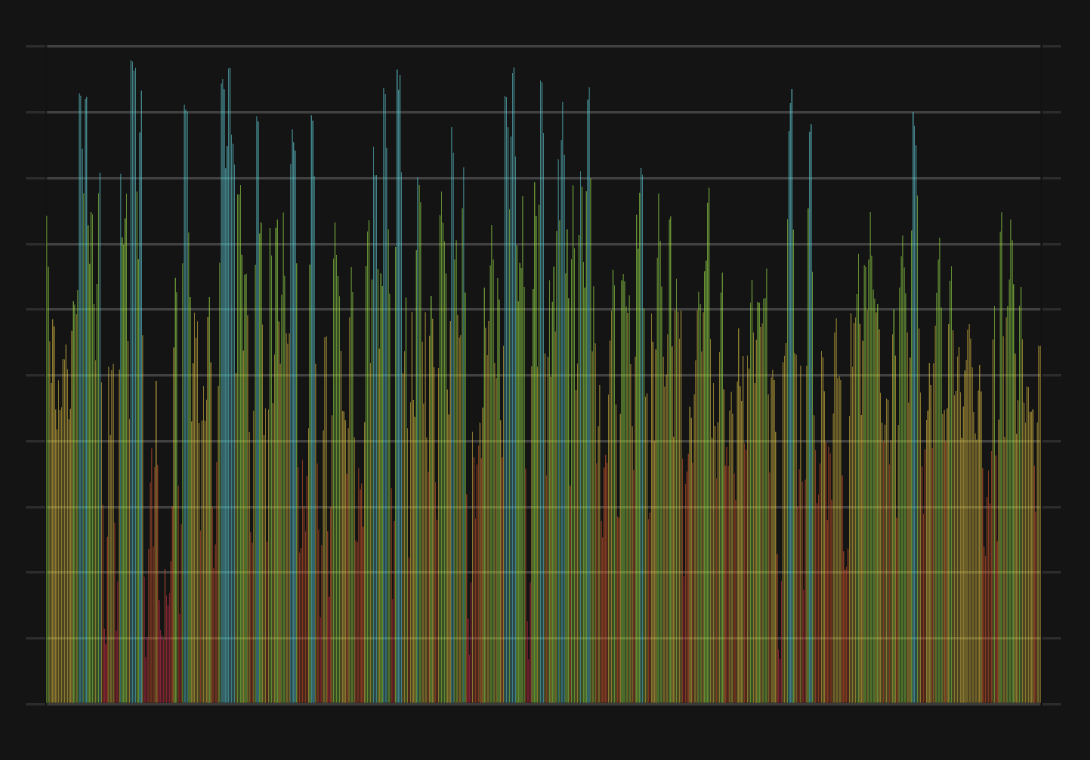
Volume Sentiment
Impulse Sentiment
Technical Sentiment
Social Sentiment
Dominance Sentiment
Search Sentiment
Whales Sentiment
Order Book Sentiment
