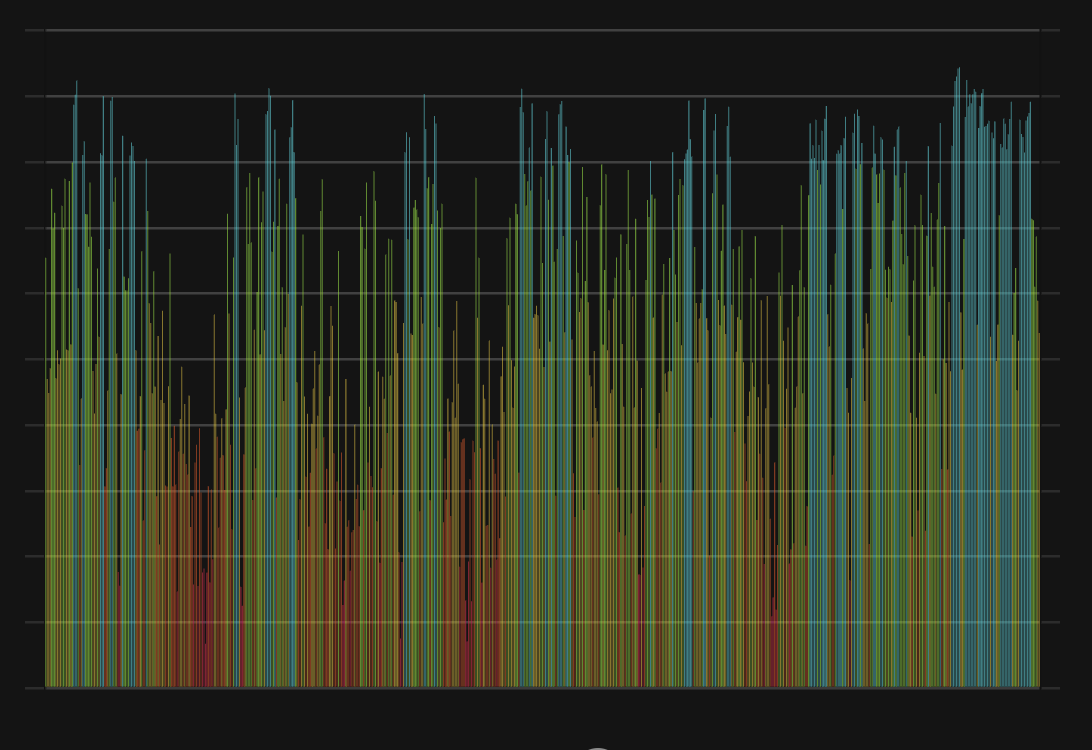
Historical Values
-
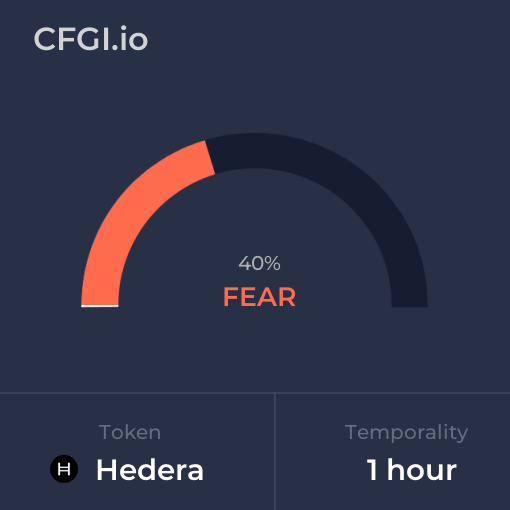
Now
Fear 37 -
Yesterday
Fear 37 -
7 Days Ago
Fear 37 -
1 Month Ago
Fear 37
Hedera Breakdown
Price Score Neutral
The Price Score indicator is a relevant indicator to analyze and assign the Hedera price evolution a certain numerical value.
This module studies the price trend to determine if the Hedera market has a bearish or bullish trend.
The main trend defines one part of the general sentiment of the market, and is a factor of weight when analyzing a chart. A pronounced and long-lasting positive trend generates a greater feeling of greed. In the same way, when the trend is negative, a greater feeling of fear is generated, regardless of other factors.
Volatility Fear
Price Volatility is also another important indicator and the biggest trigger for market sentiment. To measure it, we use values between 0 and 1 that determine the degree of current Hedera price fluctuation for the desired time frame.
Higher volatility implies a riskier market, which further polarizes bullish and bearish sentiments. An increase in volatility implies greater greed in a bull market, but also greater fear in a bear market.
Volume Fear
Like volatility, the Hedera Volume is a determining factor.
An increase in the volume implies a greater negotiation in the market, which is caused by an increase in the movements caused by an interest, which is synonymous with great sentiment. A strong volume determines a strong level of greed in Hedera bull markets, but also a strong level of panic in bear markets.
Like volatility, it is also calculated with a range between 0 and 1.
Impulse Extreme Fear
The Impulse indicator measures the current Hedera price strength compared to previous values to determine in a range from -1 to 1 how it is affecting the Hedera market sentiment.
Impulse has a huge impact on sentiment, as on a psychological level we tend to place more importance on the latest price move.
The strength of this shows price inclination that can be more or less pronounced and determines the polarity. A strong bullish impulse in a market implies a greater feeling of greed, in the same way that a strong bearish impulse generates a greater feeling of fear or panic.
Technical Neutral
It is proven that technical analyzes themselves influence market sentiment, especially those that are more popular.
The technical analysis indicator analyzes for Hedera the 26 most popular stock market indicators and subdivides them into 2 main categories that differentiate them in their type of trend indicator or oscillator. Subsequently, each one of them is averaged and assigned a certain weight based on the popularity of each one. These results fairly accurately reflect the impact generated by these charts on market analysts.
Social Extreme Greed
Dominance Extreme Fear
This other indicator takes into account the dominance of Hedera with respect to the general market. When it gets greedy, altcoin investments greatly increase and the total market capitalization increases, which also decreases Hedera's dominance. The same thing happens when the market panics but in reverse. For this reason, both the token capitalization and the total market capitalization are calculated.
But there is also a correlation between the dominance of Hedera and the dominance of the main altcoins, so the indicator calculates different values for each cryptocurrency.
Search Greed
Trends is another factor that determines the sentiment of a particular market. We analyze the search volume on Hedera has on major search engines on Google.
The lookup indicator looks at the current value and compares it to previous values to determine what particular interest there is in Hedera. For this, specific search terms are used that determine the purchasing or ceding interest of Hedera, thus excluding general terms that only define popularity without demonstrating negativity or possibility.
Whales Neutral
One of the analyzes that can determine the cryptocurrency market is the movement of whales.
CFGI analyzes the movements of superlative amounts made by large investors in two ways, first it analyzes large movements from wallets to exchanges of Hedera and compares them with the large movements of stable coins that are also made from wallets to exchanges to estimate the proportion of purchase and sale to be made.
A high ratio of Hedera moves to stablecoins indicates strong selling intent which means greed market, while a higher ratio of stablecoins moves indicates stronger buying intent and fear market.
Order Book Greed
Another great predictor of sentiment through a quantitative source are the order books. Crypto Fear and Greed Index analyzes the order book for Hedera on a popular exchange to determine the buying and selling pressure that contiguous orders exert on the price. In such a way that you can know the buying and selling pressure that the orders which are going to be executed will exert.
Stronger buying pressure than selling pressure close to price is a clear indication of bearish sentiment, as there are more buy orders within equal distance to the price. While stronger selling pressure above price indicates a bullish sentiment, because there are more sells to execute than buys at the same distance.
Hedera News
HBAR Price Prediction: Dead Cat or Real Squeeze — $0.09 Is the Make-or-Break Level

Sentiment: Positive
Read moreHBAR Whale Activity Surges Ahead of Hedera v0.74 Upgrade and Supply Shift Pressure

Sentiment: Positive
Read moreHBAR Price Prediction: $0.065 Breakdown Before Summer Rally - 60% Probability

Sentiment: Negative
Read more

Canary Funds files SEC 424B3 for HBAR spot ETF, marking a first for Hedera investors

Sentiment: Positive
Read moreHBAR Price Prediction: $0.065 Target Looms as Technical Breakdown Accelerates

Sentiment: Negative
Read moreHBAR Price Prediction: $0.065 Target Within 30 Days as Technical Breakdown Accelerates

Sentiment: Negative
Read more

HBAR Price Prediction: $0.12 Breakout Target as Technical Compression Sets Stage

Sentiment: Positive
Read more
HBAR Price Prediction: Dead Cat Bounce to $0.095 Before $0.065 Capitulation

Sentiment: Negative
Read more


HBAR Price Prediction: Critical $0.11 Zone Determines Path to $0.15 or $0.08

Sentiment: Neutral
Read moreKalshi Files for XRP, XLM, SOL, SHIB, HBAR, DOGE, & 6 Other Altcoins Perp Futures

Sentiment: Positive
Read more

HBAR Price Prediction: $0.12 Target by Mid-June as Bulls Test Critical Resistance

Sentiment: Positive
Read moreHBAR Price Prediction: $0.12 Breakout Within 14 Days as Technical Setup Strengthens

Sentiment: Positive
Read more

HBAR Price Prediction: $0.12 Within 30 Days as Technical Reset Creates Bullish Setup

Sentiment: Positive
Read more
Hedera's Enterprise Test: Can HBAR Benefit From Real-World Tokenization Demand?

Sentiment: Neutral
Read more
HBAR Price Prediction: Critical $0.086 Support Test Could Trigger 40% Bounce to $0.12
Sentiment: Positive
Read moreHBAR Price Prediction: $0.065 Target Within Two Weeks as $0.09 Support Crumbles

Sentiment: Negative
Read more

CLARITY Act Could Permanently End the SEC's War Against XRP, ADA, HBAR and XLM

Sentiment: Positive
Read moreHBAR Price Prediction: Dead Cat Bounce or Real Rally? $0.085-$0.095 Range Battle Ahead

Sentiment: Negative
Read moreHBAR Price Prediction: $0.065 Bottom Hunt Before Potential 30% Bounce to $0.12

Sentiment: Negative
Read moreHBAR Price Prediction: Dead Money Confirmed - $0.085 Target as Momentum Dies

Sentiment: Negative
Read more


HBAR Price Prediction: Range-Bound Token Eyes $0.10 Break Above Key Resistance

Sentiment: Positive
Read moreHBAR Price Prediction: $0.12 Target as Enterprise Adoption Accelerates into Q3 2026

Sentiment: Positive
Read more
HBAR Price Prediction: Consolidation at $0.09 Sets Stage for 78% Rally to $0.16

Sentiment: Positive
Read moreHBAR Eyes $0.103 Resistance as HIP-1261 Aims to Simplify Fee Structure for Enterprises

Sentiment: Positive
Read moreHBAR Price Prediction: Convergence at $0.09 Signals 20% Move Within 14 Days

Sentiment: Positive
Read moreHBAR Price Prediction: 18% Decline to $0.074 Before Year-End Recovery Targets $0.12
Sentiment: Negative
Read more


HBAR Price Prediction: $0.115 Target Within 14 Days as Bulls Test Critical Resistance

Sentiment: Positive
Read moreHBAR Eyes $0.10 Breakout as ETF Inflows and Enterprise Adoption Fuel Bullish Momentum

Sentiment: Positive
Read moreHBAR Price Prediction: $0.11 Target Within Reach as Institutional Money Floods In

Sentiment: Positive
Read moreHBAR Price Prediction: Dead Money Trapped at $0.09 - 15% Drop Coming Before Year-End Rally

Sentiment: Negative
Read more
HBAR Price Prediction: Brief Rally to $0.095 Then 65% Chance of $0.085 Drop

Sentiment: Negative
Read more
HBAR Price Prediction: $0.10 Breakout or $0.085 Retest as Momentum Stalls
Sentiment: Negative
Read more
HBAR Price Prediction: $0.095 Breakout or $0.085 Dump - 72 Hours Will Decide
Sentiment: Positive
Read moreHBAR Price Prediction: Coiled Spring Setup Points to $0.12 Target Within Two Months

Sentiment: Positive
Read moreHBAR Price Prediction: Compression Breakout Imminent - $0.12 Target Within Reach

Sentiment: Positive
Read moreHBAR Price Prediction: $0.17 Target After $0.12 Break - Institutional Money Loading

Sentiment: Positive
Read more
HBAR Price Prediction: Consolidation at $0.09 Sets Stage for $0.13 Breakout

Sentiment: Positive
Read moreHBAR Price Prediction: Critical $0.09 Consolidation Sets Stage for $0.12 Breakout

Sentiment: Positive
Read more
HBAR Price Prediction: Coiled Spring at $0.09 - Binary Move Expected Within Days

Sentiment: Positive
Read more
HBAR Price Prediction: $0.09 Stalemate Ends in 7 Days - Bulls Eye $0.12 Target
Sentiment: Positive
Read moreHBAR Price Prediction: Consolidation Breakout Eyes $0.125 — Bulls Load at $0.09

Sentiment: Positive
Read moreHBAR Price Prediction: $0.14 Breakout Locked and Loaded for February Push
Sentiment: Positive
Read moreThe “Hedera Effect” at the IMF: Is Regulatory Interoperability the Final Catalyst for HBAR?

Sentiment: Positive
Read moreHBAR Price Prediction: Sideways Grind to $0.12 Target as Bulls Stack Positions
Sentiment: Positive
Read more
HBAR Price Prediction: $0.12 Retest Expected Before Potential Rally to $0.15
Sentiment: Positive
Read moreHBAR Price Prediction: Dead Money at $0.09 - 25% Drop to $0.067 More Likely Than Bounce

Sentiment: Negative
Read more
HBAR Breaks $0.12 Within Two Weeks - Compression Setup Signals 40% Rally
Sentiment: Positive
Read moreHBAR Price Outlook: Big Tech Backing Meets Reversal Setup – Rally Ahead?

Sentiment: Positive
Read moreHBAR Price Prediction: Hedera and Stellar Top CoinDesk 20 as BTC Pushes Toward $76,000

Sentiment: Positive
Read more
Post-Quantum Race Heats Up: Algorand, HBAR & Ripple Push Real-World Deals

Sentiment: Positive
Read moreHBAR Touted As “Digital Commodity” For a Multi-Trillion Tokenization Wave

Sentiment: Positive
Read more


HBAR Price Prediction: Institutional Partnerships vs Technical Stagnation - $0.12 Target by May
Sentiment: Negative
Read more
HBAR Price Prediction: Technical Oversold Bounce Targets $0.095 by April End

Sentiment: Positive
Read moreHBAR Price Prediction: Neutral Consolidation Targets $0.10 Breakout by May 2026
Sentiment: Positive
Read moreHedera News
HBAR Price Prediction: Dead Cat or Real Squeeze — $0.09 Is the Make-or-Break Level
Sentiment: Positive
Read moreHBAR Whale Activity Surges Ahead of Hedera v0.74 Upgrade and Supply Shift Pressure
Sentiment: Positive
Read moreHBAR Price Prediction: $0.065 Breakdown Before Summer Rally - 60% Probability
Sentiment: Negative
Read moreCanary Funds files SEC 424B3 for HBAR spot ETF, marking a first for Hedera investors
Sentiment: Positive
Read moreHBAR Price Prediction: $0.065 Target Looms as Technical Breakdown Accelerates
Sentiment: Negative
Read moreHBAR Price Prediction: $0.065 Target Within 30 Days as Technical Breakdown Accelerates
Sentiment: Negative
Read moreHBAR Price Prediction: $0.12 Breakout Target as Technical Compression Sets Stage
Sentiment: Positive
Read moreHBAR Price Prediction: Dead Cat Bounce to $0.095 Before $0.065 Capitulation
Sentiment: Negative
Read moreHBAR Price Prediction: Critical $0.11 Zone Determines Path to $0.15 or $0.08
Sentiment: Neutral
Read moreKalshi Files for XRP, XLM, SOL, SHIB, HBAR, DOGE, & 6 Other Altcoins Perp Futures
Sentiment: Positive
Read moreHBAR Price Prediction: $0.12 Target by Mid-June as Bulls Test Critical Resistance
Sentiment: Positive
Read moreHBAR Price Prediction: $0.12 Breakout Within 14 Days as Technical Setup Strengthens
Sentiment: Positive
Read moreHBAR Price Prediction: $0.12 Within 30 Days as Technical Reset Creates Bullish Setup
Sentiment: Positive
Read moreHedera's Enterprise Test: Can HBAR Benefit From Real-World Tokenization Demand?
Sentiment: Neutral
Read moreHBAR Price Prediction: Critical $0.086 Support Test Could Trigger 40% Bounce to $0.12
Sentiment: Positive
Read moreHBAR Price Prediction: $0.065 Target Within Two Weeks as $0.09 Support Crumbles
Sentiment: Negative
Read moreCLARITY Act Could Permanently End the SEC's War Against XRP, ADA, HBAR and XLM
Sentiment: Positive
Read moreHBAR Price Prediction: Dead Cat Bounce or Real Rally? $0.085-$0.095 Range Battle Ahead
Sentiment: Negative
Read moreHBAR Price Prediction: $0.065 Bottom Hunt Before Potential 30% Bounce to $0.12
Sentiment: Negative
Read moreHBAR Price Prediction: Dead Money Confirmed - $0.085 Target as Momentum Dies
Sentiment: Negative
Read moreHBAR Price Prediction: Range-Bound Token Eyes $0.10 Break Above Key Resistance
Sentiment: Positive
Read moreHBAR Price Prediction: $0.12 Target as Enterprise Adoption Accelerates into Q3 2026
Sentiment: Positive
Read moreHBAR Price Prediction: Consolidation at $0.09 Sets Stage for 78% Rally to $0.16
Sentiment: Positive
Read moreHBAR Eyes $0.103 Resistance as HIP-1261 Aims to Simplify Fee Structure for Enterprises
Sentiment: Positive
Read moreHBAR Price Prediction: Convergence at $0.09 Signals 20% Move Within 14 Days
Sentiment: Positive
Read moreHBAR Price Prediction: 18% Decline to $0.074 Before Year-End Recovery Targets $0.12
Sentiment: Negative
Read moreHBAR Price Prediction: $0.115 Target Within 14 Days as Bulls Test Critical Resistance
Sentiment: Positive
Read moreHBAR Eyes $0.10 Breakout as ETF Inflows and Enterprise Adoption Fuel Bullish Momentum
Sentiment: Positive
Read moreHBAR Price Prediction: $0.11 Target Within Reach as Institutional Money Floods In
Sentiment: Positive
Read moreHBAR Price Prediction: Dead Money Trapped at $0.09 - 15% Drop Coming Before Year-End Rally
Sentiment: Negative
Read moreHBAR Price Prediction: Brief Rally to $0.095 Then 65% Chance of $0.085 Drop
Sentiment: Negative
Read moreHBAR Price Prediction: $0.10 Breakout or $0.085 Retest as Momentum Stalls
Sentiment: Negative
Read moreHBAR Price Prediction: $0.095 Breakout or $0.085 Dump - 72 Hours Will Decide
Sentiment: Positive
Read moreHBAR Price Prediction: Coiled Spring Setup Points to $0.12 Target Within Two Months
Sentiment: Positive
Read moreHBAR Price Prediction: Compression Breakout Imminent - $0.12 Target Within Reach
Sentiment: Positive
Read moreHBAR Price Prediction: $0.17 Target After $0.12 Break - Institutional Money Loading
Sentiment: Positive
Read moreHBAR Price Prediction: Consolidation at $0.09 Sets Stage for $0.13 Breakout
Sentiment: Positive
Read moreHBAR Price Prediction: Critical $0.09 Consolidation Sets Stage for $0.12 Breakout
Sentiment: Positive
Read moreHBAR Price Prediction: Coiled Spring at $0.09 - Binary Move Expected Within Days
Sentiment: Positive
Read moreHBAR Price Prediction: $0.09 Stalemate Ends in 7 Days - Bulls Eye $0.12 Target
Sentiment: Positive
Read moreHBAR Price Prediction: Consolidation Breakout Eyes $0.125 — Bulls Load at $0.09
Sentiment: Positive
Read moreHBAR Price Prediction: $0.14 Breakout Locked and Loaded for February Push
Sentiment: Positive
Read moreThe “Hedera Effect” at the IMF: Is Regulatory Interoperability the Final Catalyst for HBAR?
Sentiment: Positive
Read moreHBAR Price Prediction: Sideways Grind to $0.12 Target as Bulls Stack Positions
Sentiment: Positive
Read moreHBAR Price Prediction: $0.12 Retest Expected Before Potential Rally to $0.15
Sentiment: Positive
Read moreHBAR Price Prediction: Dead Money at $0.09 - 25% Drop to $0.067 More Likely Than Bounce
Sentiment: Negative
Read moreHBAR Breaks $0.12 Within Two Weeks - Compression Setup Signals 40% Rally
Sentiment: Positive
Read moreHBAR Price Outlook: Big Tech Backing Meets Reversal Setup – Rally Ahead?
Sentiment: Positive
Read moreHBAR Price Prediction: Hedera and Stellar Top CoinDesk 20 as BTC Pushes Toward $76,000
Sentiment: Positive
Read morePost-Quantum Race Heats Up: Algorand, HBAR & Ripple Push Real-World Deals
Sentiment: Positive
Read moreHBAR Touted As “Digital Commodity” For a Multi-Trillion Tokenization Wave
Sentiment: Positive
Read moreHBAR Price Prediction: Institutional Partnerships vs Technical Stagnation - $0.12 Target by May
Sentiment: Negative
Read moreHBAR Price Prediction: Technical Oversold Bounce Targets $0.095 by April End
Sentiment: Positive
Read moreHBAR Price Prediction: Neutral Consolidation Targets $0.10 Breakout by May 2026
Sentiment: Positive
Read moreHistorical Values
-
Now
Fear 37 -
Yesterday
Neutral 37 -
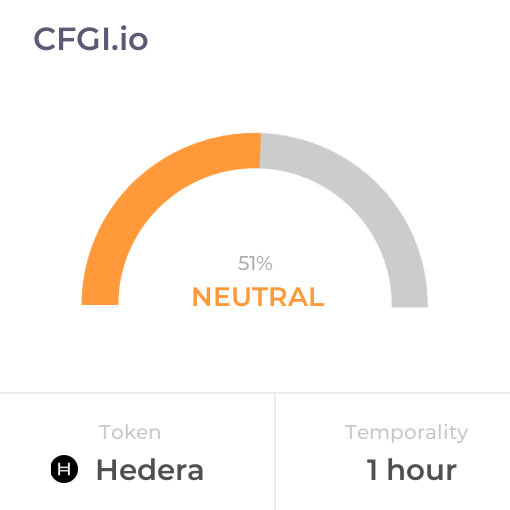
7 Days Ago
Neutral 57 -
1 Month Ago
Neutral 45
Hedera Breakdown
Price Score Neutral
The Price Score indicator is a relevant indicator to analyze and assign the Hedera price evolution a certain numerical value.
This module studies the price trend to determine if the Hedera market has a bearish or bullish trend.
The main trend defines one part of the general sentiment of the market, and is a factor of weight when analyzing a chart. A pronounced and long-lasting positive trend generates a greater feeling of greed. In the same way, when the trend is negative, a greater feeling of fear is generated, regardless of other factors.
Volatility Fear
Price Volatility is also another important indicator and the biggest trigger for market sentiment. To measure it, we use values between 0 and 1 that determine the degree of current Hedera price fluctuation for the desired time frame.
Higher volatility implies a riskier market, which further polarizes bullish and bearish sentiments. An increase in volatility implies greater greed in a bull market, but also greater fear in a bear market.
Volume Fear
Like volatility, the Hedera Volume is a determining factor.
An increase in the volume implies a greater negotiation in the market, which is caused by an increase in the movements caused by an interest, which is synonymous with great sentiment. A strong volume determines a strong level of greed in Hedera bull markets, but also a strong level of panic in bear markets.
Like volatility, it is also calculated with a range between 0 and 1.
Impulse Extreme Fear
The Impulse indicator measures the current Hedera price strength compared to previous values to determine in a range from -1 to 1 how it is affecting the Hedera market sentiment.
Impulse has a huge impact on sentiment, as on a psychological level we tend to place more importance on the latest price move.
The strength of this shows price inclination that can be more or less pronounced and determines the polarity. A strong bullish impulse in a market implies a greater feeling of greed, in the same way that a strong bearish impulse generates a greater feeling of fear or panic.
Technical Neutral
It is proven that technical analyzes themselves influence market sentiment, especially those that are more popular.
The technical analysis indicator analyzes for Hedera the 26 most popular stock market indicators and subdivides them into 2 main categories that differentiate them in their type of trend indicator or oscillator. Subsequently, each one of them is averaged and assigned a certain weight based on the popularity of each one. These results fairly accurately reflect the impact generated by these charts on market analysts.
Social Extreme Greed
Dominance Extreme Fear
This other indicator takes into account the dominance of Hedera with respect to the general market. When it gets greedy, altcoin investments greatly increase and the total market capitalization increases, which also decreases Hedera's dominance. The same thing happens when the market panics but in reverse. For this reason, both the token capitalization and the total market capitalization are calculated.
But there is also a correlation between the dominance of Hedera and the dominance of the main altcoins, so the indicator calculates different values for each cryptocurrency.
Search Greed
Trends is another factor that determines the sentiment of a particular market. We analyze the search volume on Hedera has on major search engines on Google.
The lookup indicator looks at the current value and compares it to previous values to determine what particular interest there is in Hedera. For this, specific search terms are used that determine the purchasing or ceding interest of Hedera, thus excluding general terms that only define popularity without demonstrating negativity or possibility.
Whales Neutral
One of the analyzes that can determine the cryptocurrency market is the movement of whales.
CFGI analyzes the movements of superlative amounts made by large investors in two ways, first it analyzes large movements from wallets to exchanges of Hedera and compares them with the large movements of stable coins that are also made from wallets to exchanges to estimate the proportion of purchase and sale to be made.
A high ratio of Hedera moves to stablecoins indicates strong selling intent which means greed market, while a higher ratio of stablecoins moves indicates stronger buying intent and fear market.
Order Book Greed
Another great predictor of sentiment through a quantitative source are the order books. Crypto Fear and Greed Index analyzes the order book for Hedera on a popular exchange to determine the buying and selling pressure that contiguous orders exert on the price. In such a way that you can know the buying and selling pressure that the orders which are going to be executed will exert.
Stronger buying pressure than selling pressure close to price is a clear indication of bearish sentiment, as there are more buy orders within equal distance to the price. While stronger selling pressure above price indicates a bullish sentiment, because there are more sells to execute than buys at the same distance.
HBAR Price
1 HBAR = $0.08
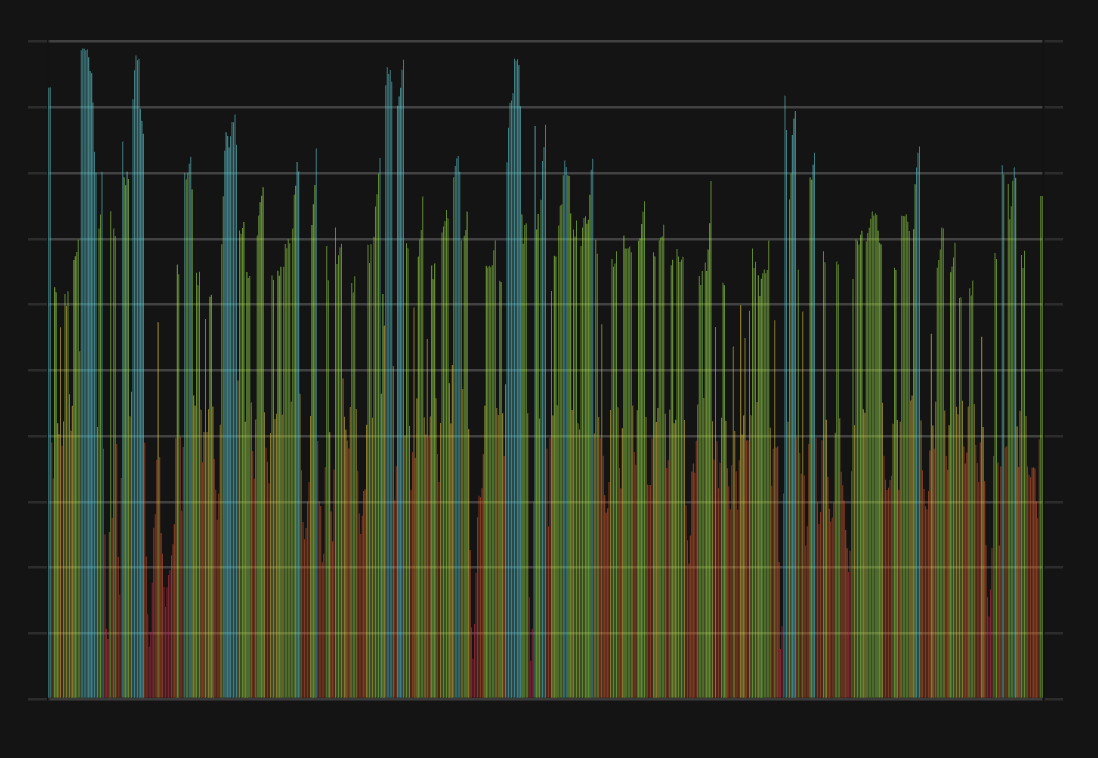
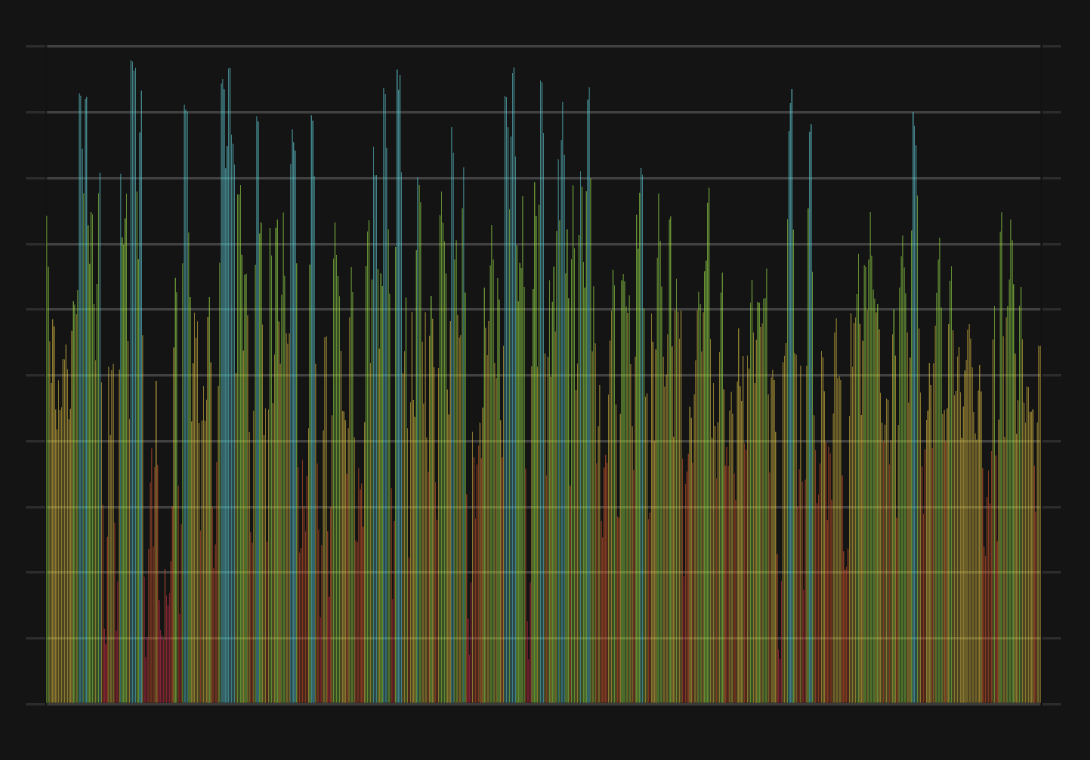
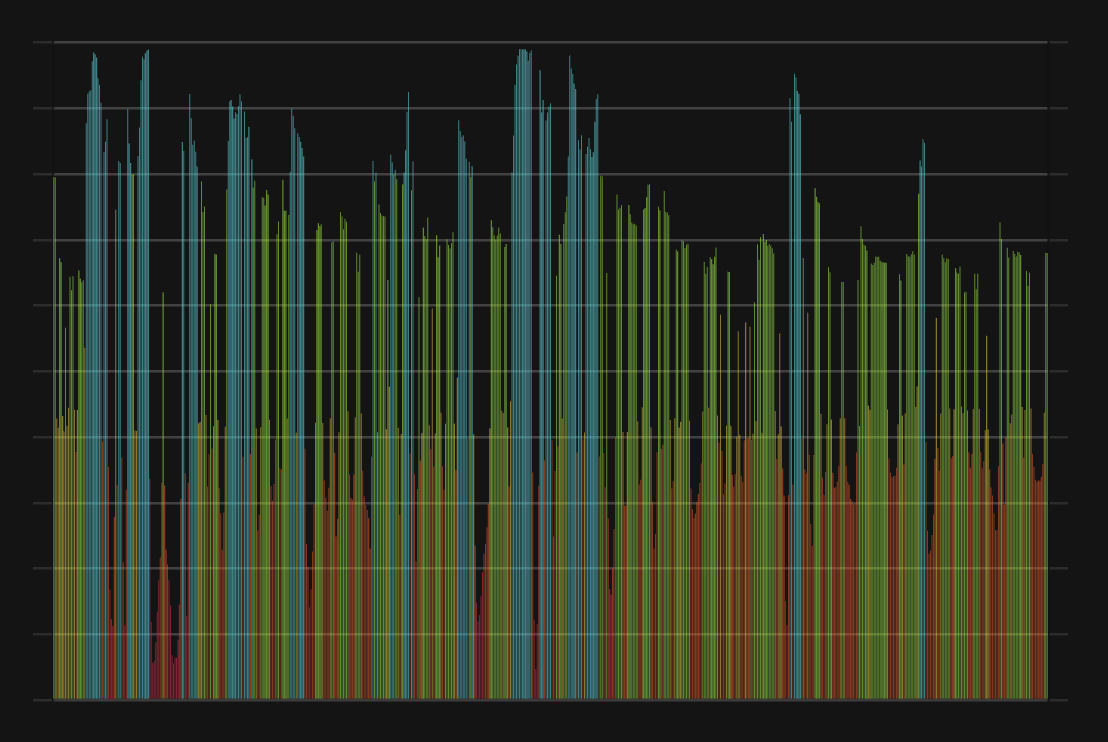
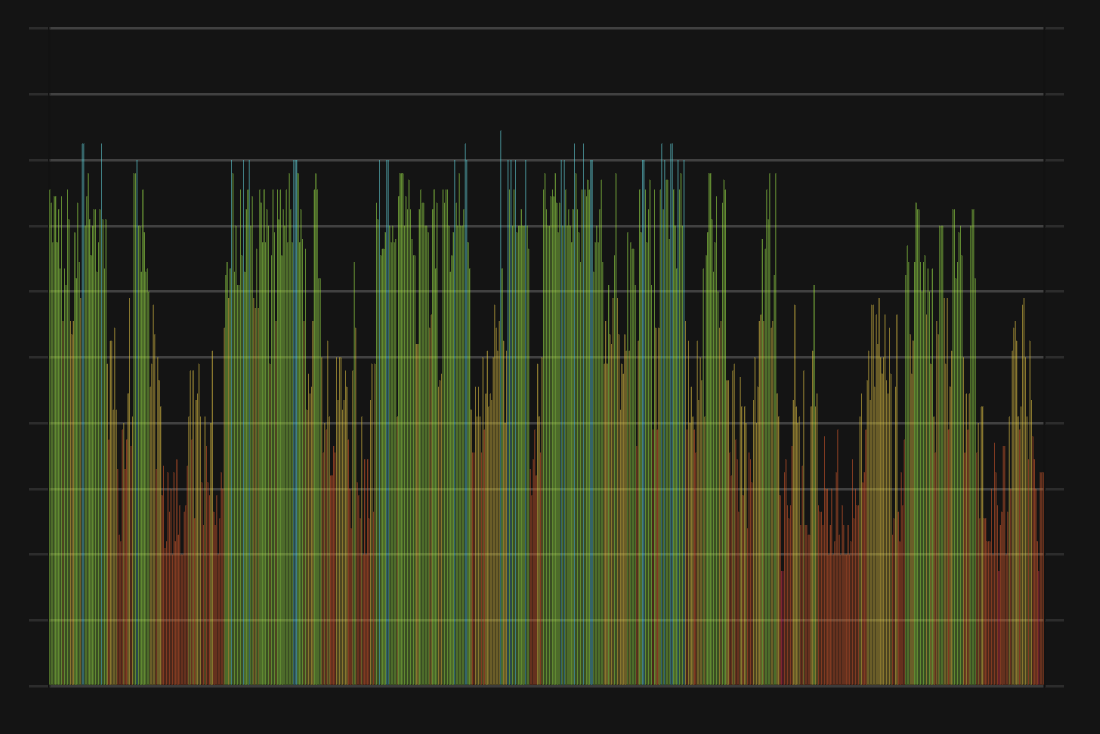
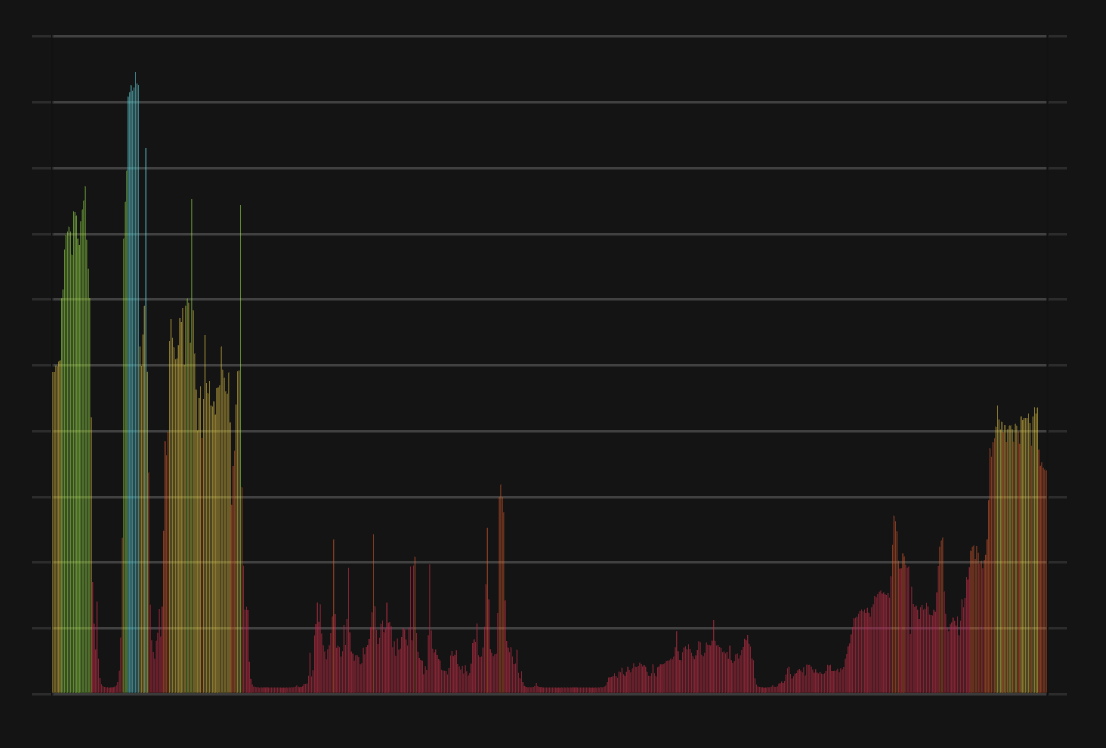
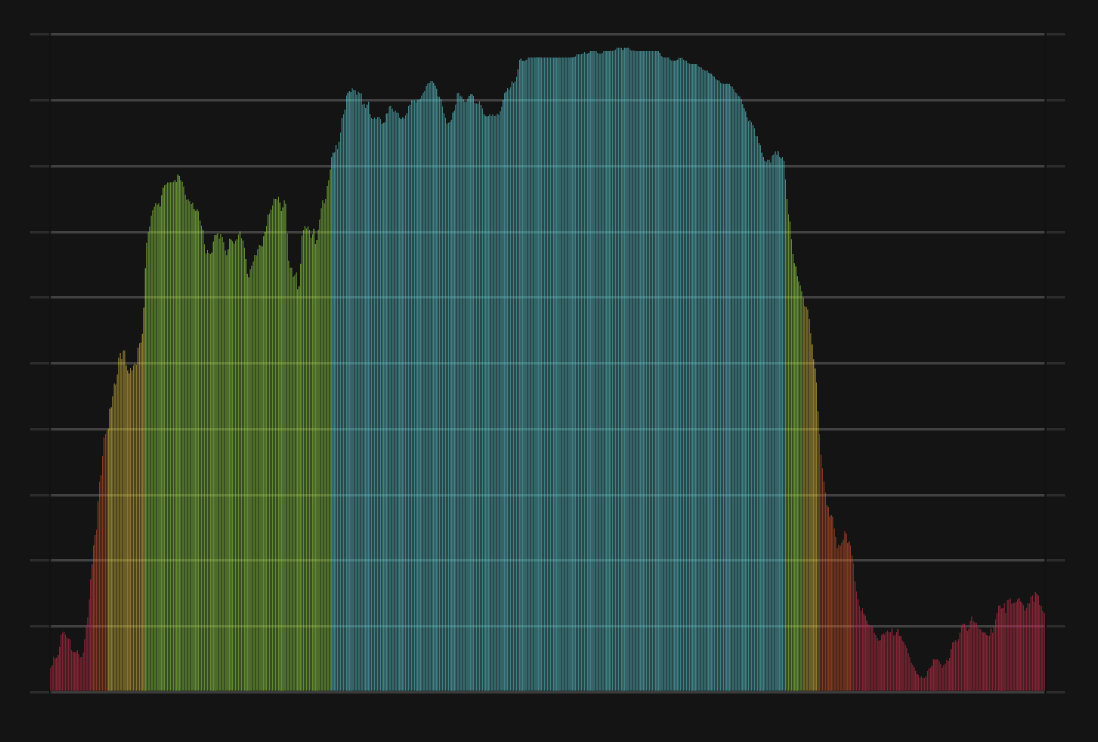
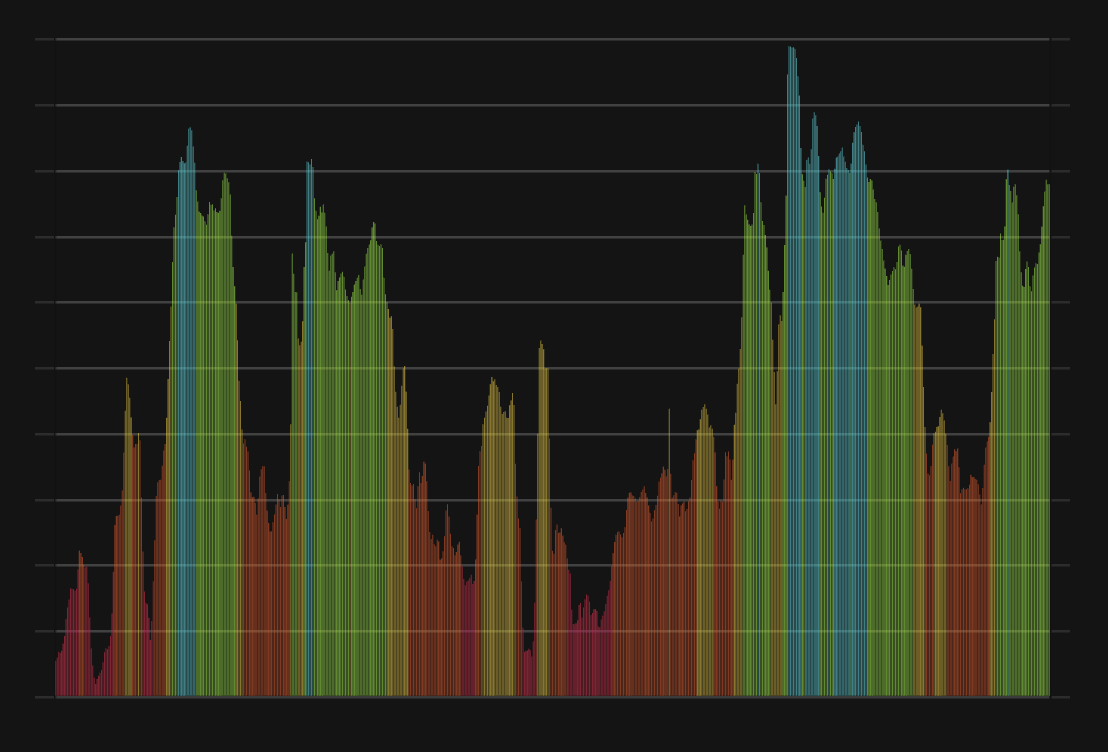
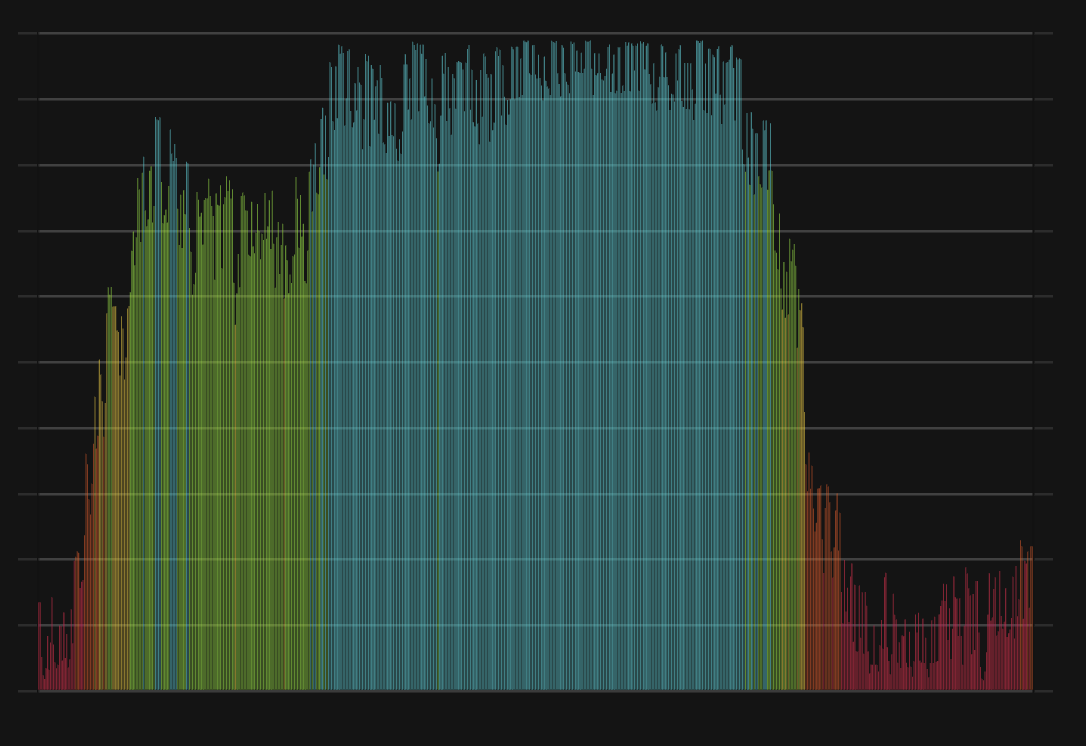
Hedera CFGI Score & HBAR Price History
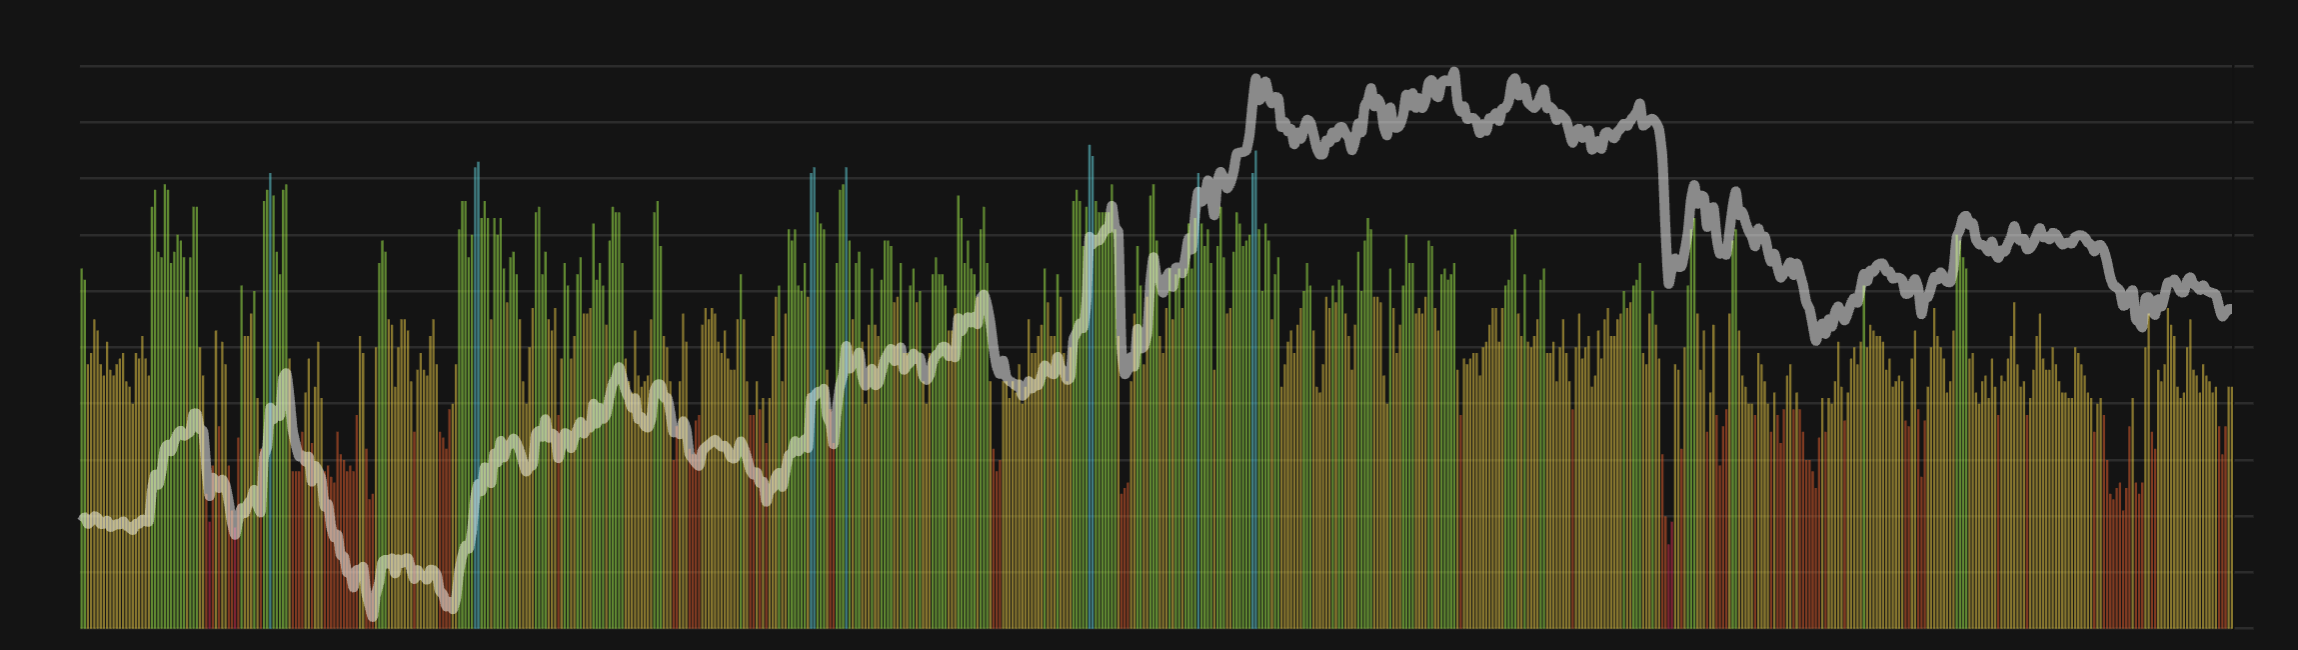
HBAR Price & Hedera Sentiment Breakdown Charts
Price Score Sentiment
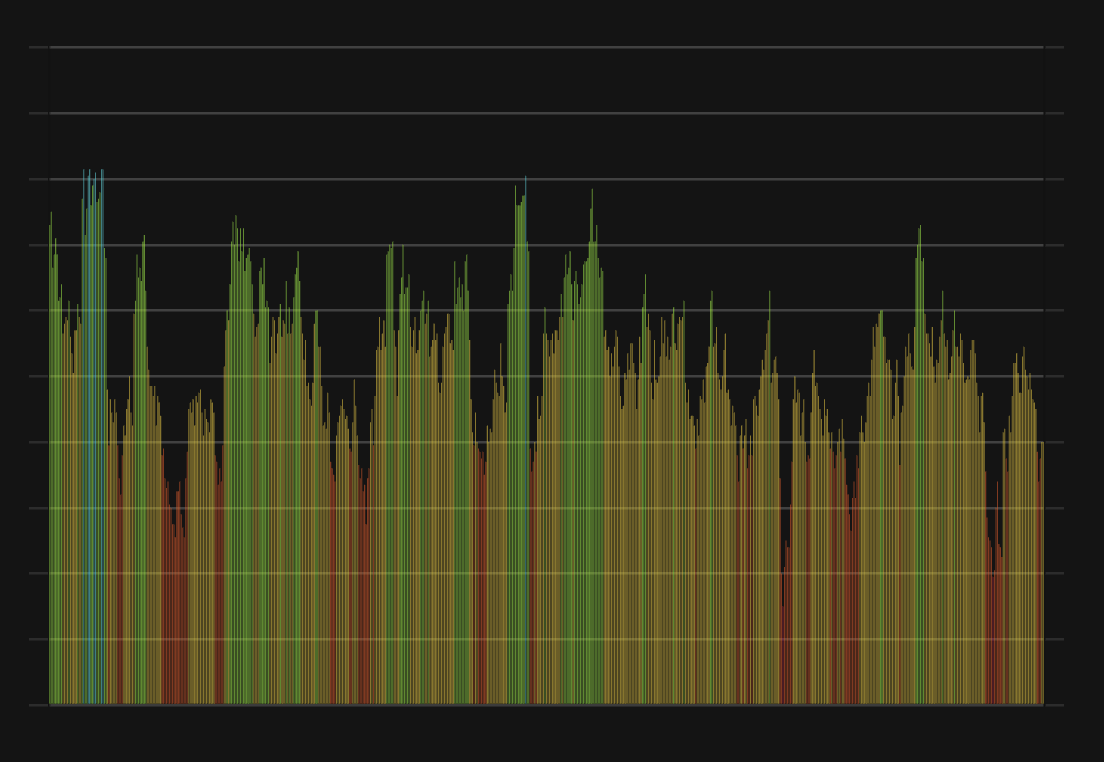
Volatility Sentiment
Volume Sentiment
Impulse Sentiment
Technical Sentiment
Social Sentiment
Dominance Sentiment
Search Sentiment
Whales Sentiment
Order Book Sentiment